3 of 5 systems run on live data in your browser Stored prices as of 2026-10-12
SAMUEL HEISTER
0102030405

Samuel Heister

SharpEye Capital, and the systems I built getting there.

I build market and data systems. SharpEye is the big one; five smaller ones sit alongside it, and three of those are open below on live data — running in your browser rather than screenshotted.

Drawn by
Samuel Heister
Location
Cambridge, Maryland
Currently
Benefits consultant, Aflac
Contents
5 sheets · 3 live
Prices as of
2026-10-12

SharpEye Capital

the main build

A market-intelligence platform and an automated operation trading prediction-market binaries, across the companies building AI infrastructure.

Seven deskseach watching one domain
One decision layerweighs them; none acts alone
Two enginesequities and prediction markets
Risk and treasurycan halt both; sees every position
A strategy labnothing ships untested

The firm's own figures are not published here. Signals, thresholds, formulas and sizing stay abstracted by design; what follows is architecture, and the parts anyone can check. Its language work runs on Anthropic's API — the firm does not train or serve a model of its own.

How it is put together

Four sheets, because one drawing could not carry it: what it watches, the seven desks, how a view becomes a position, and how a strategy earns real money.

the normal pathwhere a decision can be stopped1 · WHAT IT WATCHES · five rooms, five different questionsDATA CENTREevery price feedNEWSROOMnews and catalystsSUPPLY CHAINwho supplies whomOPTIONSwhat traders price inBIG MONEY FLOWwhere size is moving2 · WHAT IT DECIDESTHE BRAINcombines every room's vieweach room hands it one view; it weighs them togetherrather than letting any single one act alone3 · WHAT IT DOES · two engines, separate on purposeEQUITIES ENGINEplaces and manages ordersPREDICTION MARKETSbinary positions and exits4 · WHAT WATCHES IT, AND WHAT TESTS ITRISK AND LIMITScan halt everythingTREASURYall money, all positionsSTRATEGY LABprove it before it shipsone switch stops both enginesone place to see every positionnothing reaches an engine untested
FIG 0.1The whole operation on one sheet. Five rooms watch different things, one layer decides, two engines act, and risk can stop both of them.
a view handed to the brainthe combiner, not a deskSEVEN DESKS · each watches one domain and hands over ONE viewTHE ECONOMYrates and conditionsSUPPLY CHAINwho depends on whomWORLD EVENTSnews that moves pricesCOMPANY EVENTSdeals and failuresORDER FLOWwhat is being boughtBIG MONEYwhere size is movingOPTIONSwhat movement costsEvery desk states its view the same way, so they can be compared rather than argued about.None of them is allowed to act by itself.THE BRAINweighs the seven togetherone strong view is not enough; agreement is what counts
FIG 0.2Seven desks, each watching one domain and handing over exactly one view. None of them is allowed to act on its own.
the normal patha gate that can refuseFROM A VIEW TO A POSITION · four gates, any one of which says noSEVEN VIEWSone from each deskCOMBINE THEMweighted, not averagedDO THEY AGREE?one view is not enoughIS IT WORTH IT?after costs, not beforeeach answers thesame questiona desk with a betterrecord counts for moredisagreement meansno position at allfees and spread comeoff the top firstHOW BIG, AND CAN WE?limits first, then sizethe limits are checked BEFORE the size is chosen, so agood idea cannot talk its way past a hard capSEND IT, THEN WATCH ITthe engine takes overthe exit is decided by the same machinery that entered
FIG 0.3How a view becomes a position, and every gate that can refuse it. Costs come off before a decision, and limits are checked before size is chosen.
promotedsent back or killedthe decision pointHOW A STRATEGY EARNS REAL MONEY · it can fail at any stageON PAST DATAdoes it work at allON LIVE DATAno money at riskSMALL, REALmoney, but littleFULL SIZEonly after the restand cheaplythe honest testreality bites hererarely reachedmost die here, and the record of what died is keptAND THEN IT IS WATCHEDan edge does not lastKalBot on sheet 05 is one that stopped working, and it ispublished in full rather than quietly retired
FIG 0.4How a strategy earns real money: past data, live data with nothing at risk, small real money, then full size. Most die before the third stage.
feeds the layer belowthe combinerWHAT IS IN THE BRAIN · 57 modules, nine layers, each one measured before it is trustedECONOMY8 modulesSUPPLY6 modulesGEO5 modulesCOMPANY6 modulesFLOW6 modulesWHALE4 modulesOPTIONS7 modulesTHE COMBINER8 more modules weigh the sevenTHE MEASUREMENT LOOP7 modules · did it actually work?what it learns goes back to the desksAND MOST OF IT IS NOT RUNNING · every module carries one of these:LIVEearned its placeBENCHEDbuilt, measured, not trusted yetOBSERVEDwatched, never traded onA firm with all fifty-seven live would be a firm that never measured any of them.
FIG 0.5What is actually inside it. Fifty-seven separate modules across nine layers — counted from the build's own documentation, not estimated — and a status on every one of them, because most of what gets built does not earn a place in the live path.

The terminal this grew out of

These are captures of an earlier dashboard — the one built to track what was failing, which paths were wrong, and what needed rebuilding. Its rooms now live inside the 3D ecosystem above, connected rather than side by side. It is here because the instrumentation is where the current design came from, not because it is what runs today. Redacted where positions or sizing would be readable; cropped, never recoloured.
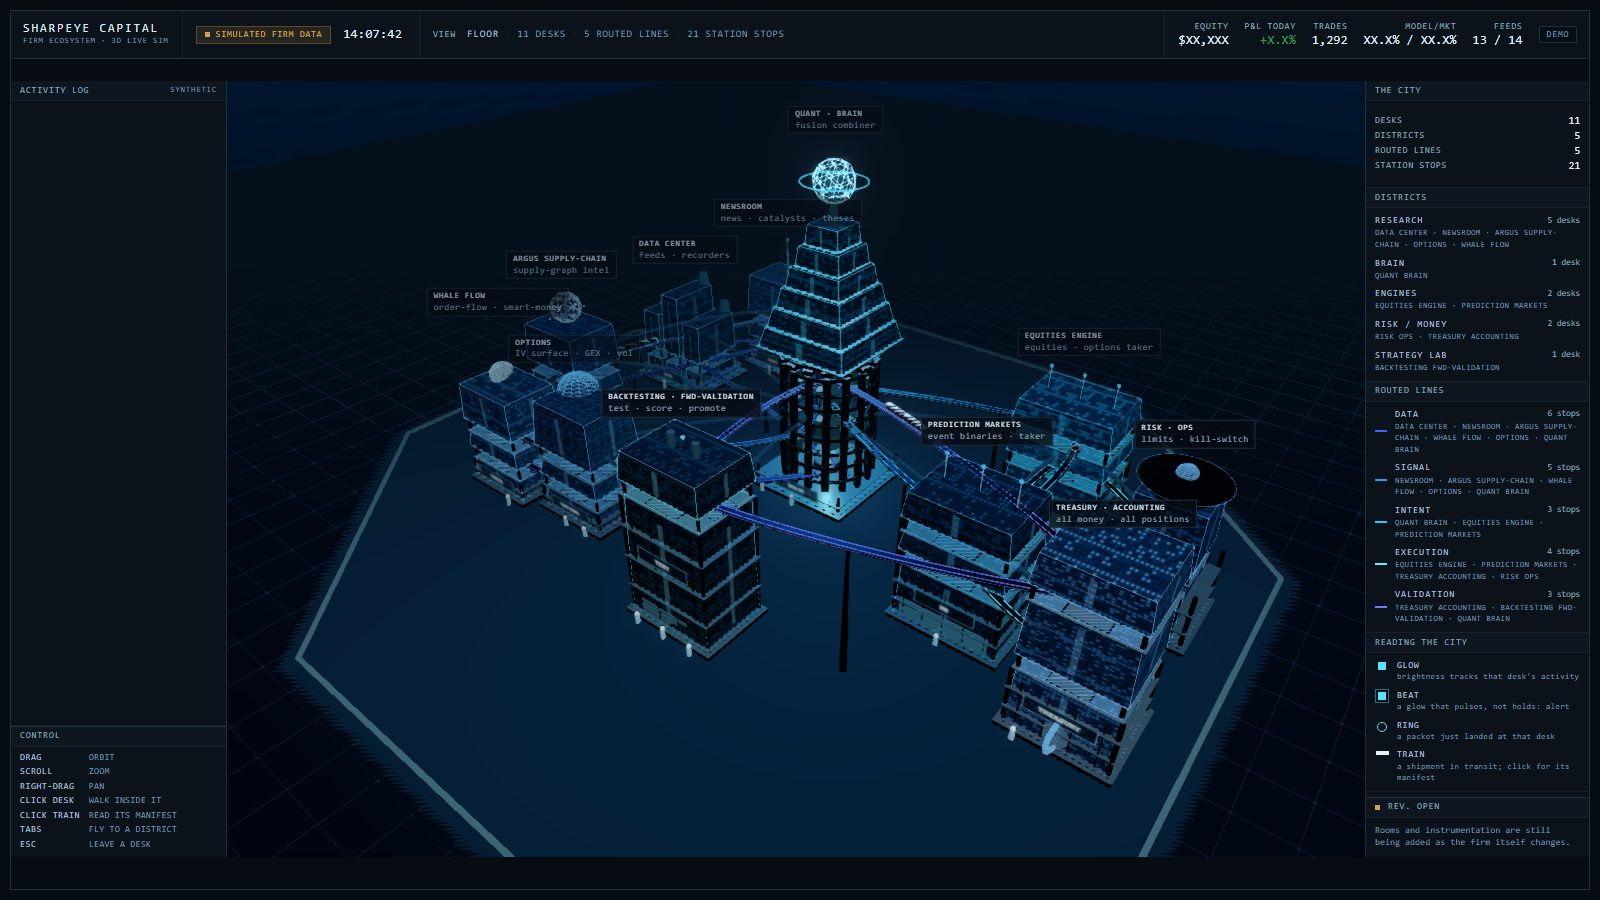
SharpEye Capital firm ecosystem, 3D
FIG 0.6Every building is a real room and every train a real dataflow. The firm's own numbers inside are masked demo values under their own badge; the ticker carries real closes under a separate one, because one mark cannot honestly cover two states.

The other systems

five of them · three you can use

SHEET 01

CASE STUDY

ARGUS

Who supplies whom in AI infrastructure, with a source for every connection

A map of who supplies whom across the companies building AI infrastructure. Every connection says how confident it is and which document it came from, so a claim can be checked rather than taken on trust. Partners and competitors were not recorded at all before this; now all four kinds are.

What it maps
2,930 connections across 72 companies
Where they came from
2,119 of them name the filing they were read out of
This is the demo set
A working slice, not the full graph. The complete version covers far more of the infrastructure; this carries enough to check the method against its sources
FILINGS10-K · 10-Q · disclosuresFIND THE LINKSwho supplies whomTHE MAP2,930 links · 72 firmsFOUR CLASSESsupplier · customer · partner · peer2,119 of the 2,930 links name the document they came frompartners and peers had no encoding beforeHOW BIG IS IT?answerable for 50 of 2,930the other 2,880 say "not disclosed" instead of guessingA LINK TO READ824 of the 2,930SCREENERtrace a shock through the chain
FIG 1.9Every connection names the document it came from. The question "how big is it?" is a box rather than a footnote, because it is answerable for only 50 of the 2,930.
FIG 1.8A faithful clone of the commercial tool would show mostly blank percentage columns. This one says which edges it can quantify and which it cannot.

SHEET 02

USABLE · LIVE DATA

Sector Board

Which parts of the market are leading, recalculated as you watch

Five years of daily prices for the S&P 500 and the 11 funds that split it into sectors are stored inside the page, then topped up with live prices when it opens. Nothing here is a screenshot: every number is recalculated in your browser, so you can wind the date back and watch the whole board change.

What it covers
The S&P 500 and the 11 funds that divide it up — technology, energy, healthcare, utilities and the rest
How much history
1,254 trading days, about five years
Price used
Adjusted close — the price with dividends added back in. Using the plain price instead mis-ranks the steady, higher-yielding sectors by a wide margin
How it is checked
The same maths is written twice — once in the page, once in Python — and the build stops if the two disagree on any of 240 numbers
BAKE1,254 sessions · 12 seriesCALENDARretry · keep the longestADJUSTED CLOSEdividends inRECOMPUTE IN BROWSERreturns, and how unusual they arenever intersected across tickersa hole would delete the session for all 12BOARDwhat leadsROTATIONwhere money movesMETHODwhy believe itmetrics_reference.pythe same maths, in Python240 values compared on every build · one mismatch stops it
FIG 2.0What it actually does: the prices are stored, not scraped live, and every figure on the board is worked out again in your browser each time you change something.
FIG 2.1Written twice, on purpose. If the two versions disagree on a single number, nothing ships — which is the only way to catch a formula that is confidently wrong.

SHEET 03

USABLE · LIVE DATA

Balance Sheet Bot

Company health, with the filing that reported every figure

The tool reads annual reports filed with the SEC and grades a company's balance sheet on 19 ratios in five weighted groups. It runs across the AI-infrastructure sector; the version on this page is a fixed snapshot of 20 of the largest, five years each, so it works without a server and every figure can be checked against the document it came from.

Scope
The tool covers the AI-infrastructure sector. This page carries a fixed snapshot of 20 of the largest, so it needs no server
The model
19 ratios in 5 weighted groups — debt and profit 25% each, cash and quality 20%, growth 10% — then a letter and a direction
Numbers checked
3,233 matched to a line the filing actually prints
Years verified
95 of 95 company-years pass every column check
If a check fails
the build stops — there are 14 of them, and none is optional
the normal pathonly when a number is missingthe part that is easy to get wrong1 · WHERE THE NUMBERS COME FROMSEC DATA FEEDthe numbers, machine readableTHE FILING ITSELFfor figures only on the pageUSE EACH NUMBER'S OWN YEARnot the year of the reportthe same balance sheet appears in two reports;the earliest one to print it wins14 CHECKSa failure stops the builda part of a total may neverbe larger than the total2 · WHAT GETS CALCULATED FROM THEMFILL IN THE GAPStotals a company left oute.g. gross profit, or current assets19 RATIOS, 5 GROUPScash, debt, profit, quality, growthcurrent ratio, debt to equity, margins,accruals, revenue growth, and so on3 · HOW THOSE TURN INTO A GRADESCORE EACH RATIO0 to 100, on five levelsless is better for debt, so thosescore upside down on purposeWEIGHT THE 5 GROUPSthey sum to 100debt 25, profit 25, cash 20,quality 20, growth 10A LETTER, A+ TO F13 bands, 95 down to 40AND A DIRECTIONbetter or worse than 2yr agoa 5 point dead band, so noiseis not reported as a change4 · TWO PUBLISHED TESTS, RUN ALONGSIDE THE GRADEPIOTROSKI F-SCOREnine pass or fail testsALTMAN Z-SCOREdistance from distressneither feeds the grade above - they are a second opinionfrom published academic work, shown next to it
FIG 3.0Four stages: where the numbers come from, what gets calculated from them, how 19 ratios become one letter grade, and the two published tests run alongside it. Drawn from the scorer itself, so the weights and bands are the real ones.
FIG 3.1A data vendor hands you a number. The filing hands you the number and the page it is printed on.

SHEET 04

USABLE · LIVE DATA

KRITERION

Whether getting a collectible card professionally graded actually pays

Collectors pay companies to authenticate a card and score its condition, and a high score can multiply what it sells for. This checks 2846 cards and works out, after every single cost, whether sending each one in would actually make money. 957 would. The rest look profitable right up until you count the fees.

What it checks
2846 cards, priced across seven grading companies
How many pay
957 of 2846, once every cost is counted
What counts as a cost
Grading, postage both ways, handling, the selling fee and sales tax — and profit is measured against everything spent, not just the card's price
The surprise
The cheapest grader is the worst deal. Its scores sell for so much less that the money saved on fees disappears
What it disproved
Two fee figures repeated all over the hobby are not in the graders' current terms at all
SCAN113 cards · PriceChartingscheduled, not on demandTOTAL COSTraw ×1.06 + grade + postevery fee read at primary sourceWHAT IS LEFTboth outcomes, weighted by oddsRETURNon everything spentnot over rawSEVEN GRADERSpremium vs fee savingPSA gives the biggest book at all 144 basesBUY LIST7 of 113 clear the bar6 still clear once a small sample is treated as uncertain
FIG 4.0The full round trip: what the card costs to buy, what it costs to grade and sell, and what is left. Run across seven grading companies rather than assuming one.
FIG 4.1An earlier version measured profit against the card's own price — the smallest number in the whole transaction — which is how a card that actually loses money showed a +816% return.

SHEET 05

CASE STUDY

KalBot

How a small advantage disappeared, and why the win rate never showed it

A binary settles at 100¢, so the arithmetic is exact rather than modelled: the book received 970 of 990, which puts breakeven at 97.98¢. So the edge — the margin that made the strategy profitable at all — was 2.02¢ wide. A win rate cannot see a gap that small closing, which is why the strategy looked healthy right up until it was not.

Recorded
The endpoints and the whole right column — mechanism, not model
Modelled
Three curves from one decay exponent, and the exponent is a slider
Control
An ENDPOINTS ONLY button strips every modelled mark
RECORDED · EXACTTHE BOOK970 wins · 20 lossesBREAKEVEN100 × 970/990 = 97.98¢THE EDGE2.02¢ widea hit rate cannot see it closePER TRADE$2,858 / 990 = $2.89MODELLED · ONE EXPONENTDECAY EXPONENTa slider, not a fitTHREE CURVESboth ends pinned to recordENDPOINTS ONLY strips every modelled markPAPERforwardLIVEreal sizeRETIREDedge consumed42 losing cycles / 20 losses = 2.10 — one loss resets the count
FIG 5.4Two rows because there are two kinds of claim: the top is arithmetic a binary settlement makes exact, the bottom is one modelled exponent with both ends pinned and a slider.
FIG 5.0The panel's subject is a number that looked better than it was, so a fabricated curve would refute the story. The slider and the toggle are the claim.

Why the numbers can be trusted

The honesty contract

Every system ships with a dated snapshot to fall back on, and replaces it with live data only on a response that passed every check. The badge always states which of the two you are reading, and how old it is. A panel that quietly falls back while still claiming to be live is worse than one that never tried.

Every label describes the numbers you are actually looking at, not the last thing the system tried to do. Never show live-looking numbers that did not come from a live fetch — and never disclaim numbers that did.

That is a testable property rather than a claim about care, so it gets tested adversarially. The most recent pass asked whether a real ticker could ever carry a price it did not fetch. It found two defects sharing one root cause — a refusal path that restored the display on transport failures but not on malformed responses — and both are fixed and re-verified.

Where a figure cannot be verified, it is labelled rather than dropped. The supply map can put a dollar size on 50 of its 2,930 connections and says so on its face; the firm simulation's own profit and loss is masked demo data under a separate badge, because one claim cannot honestly cover two states.